Microsoft Creative Insights Presentations
I first started working with Microsoft’s media buying team in 2017 to get access to performance data so we could report back to our clients on how creative was doing out in the wild and make recommendations and informed creative decisions. Fast forward a few years and news spread about our agency’s ability to translate complex data sets into clear, actionable insights, and other teams within Microsoft began asking us to do the same for them. In 2021, we began presenting quarterly to several of the accounts we served including Microsoft 365 (Office) Consumer and Small Business, Xbox, and Enterprise. Our goal each quarter was to design slides that were beautiful, easy to understand and easy to share.
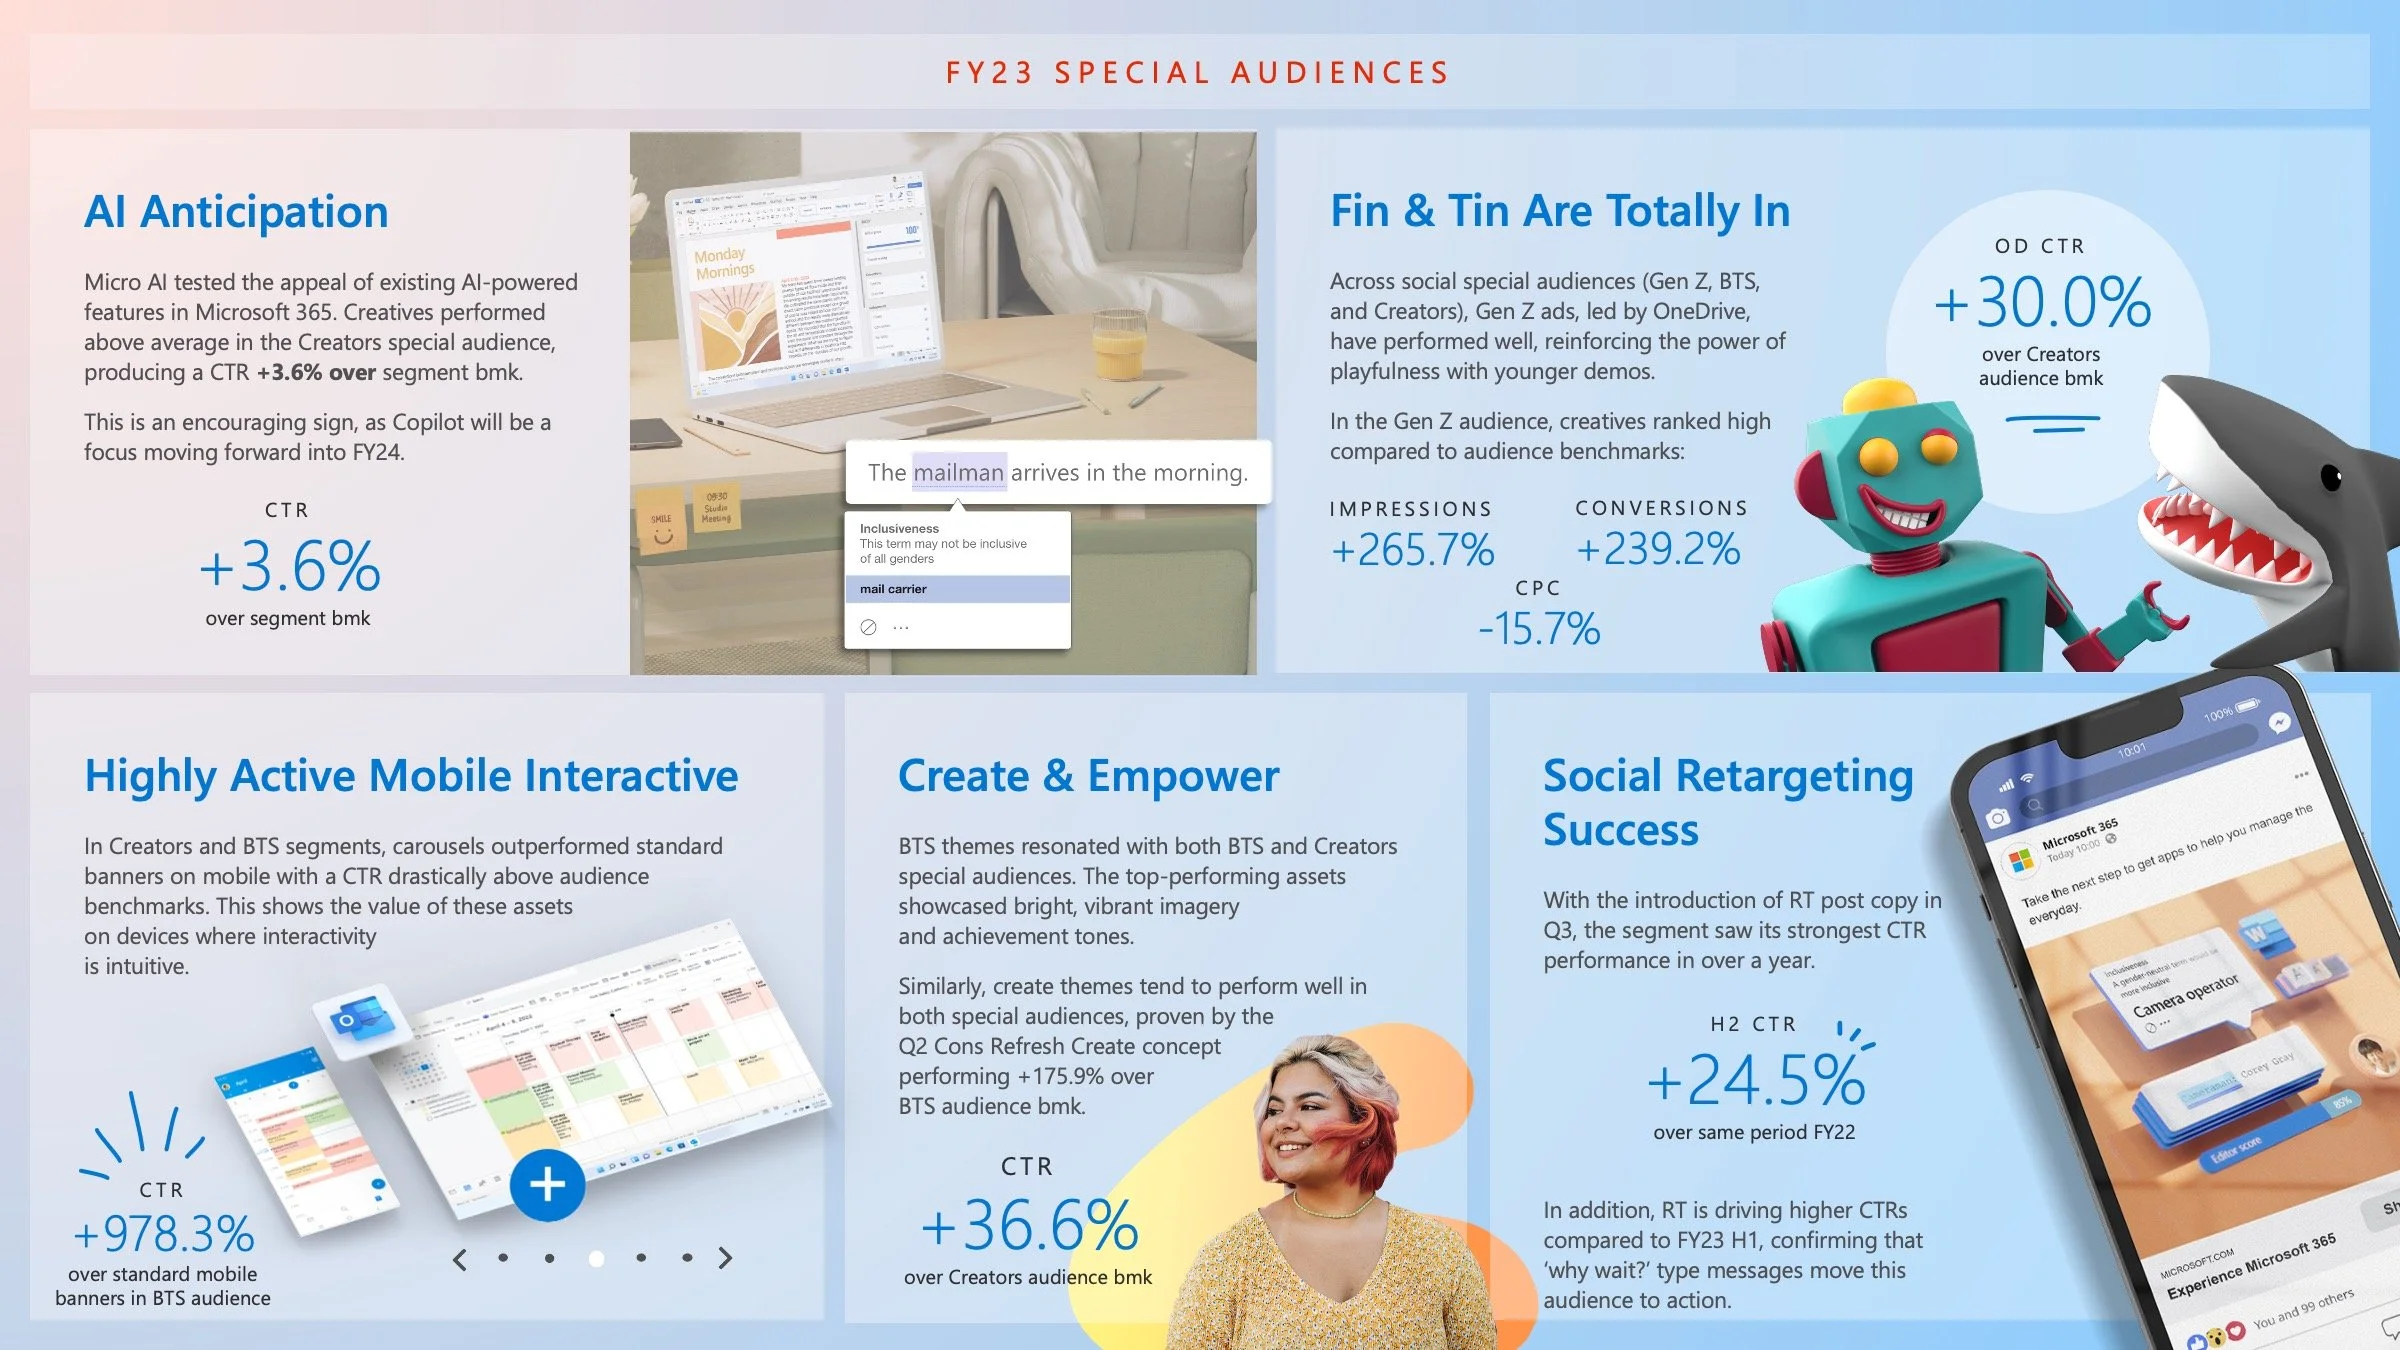
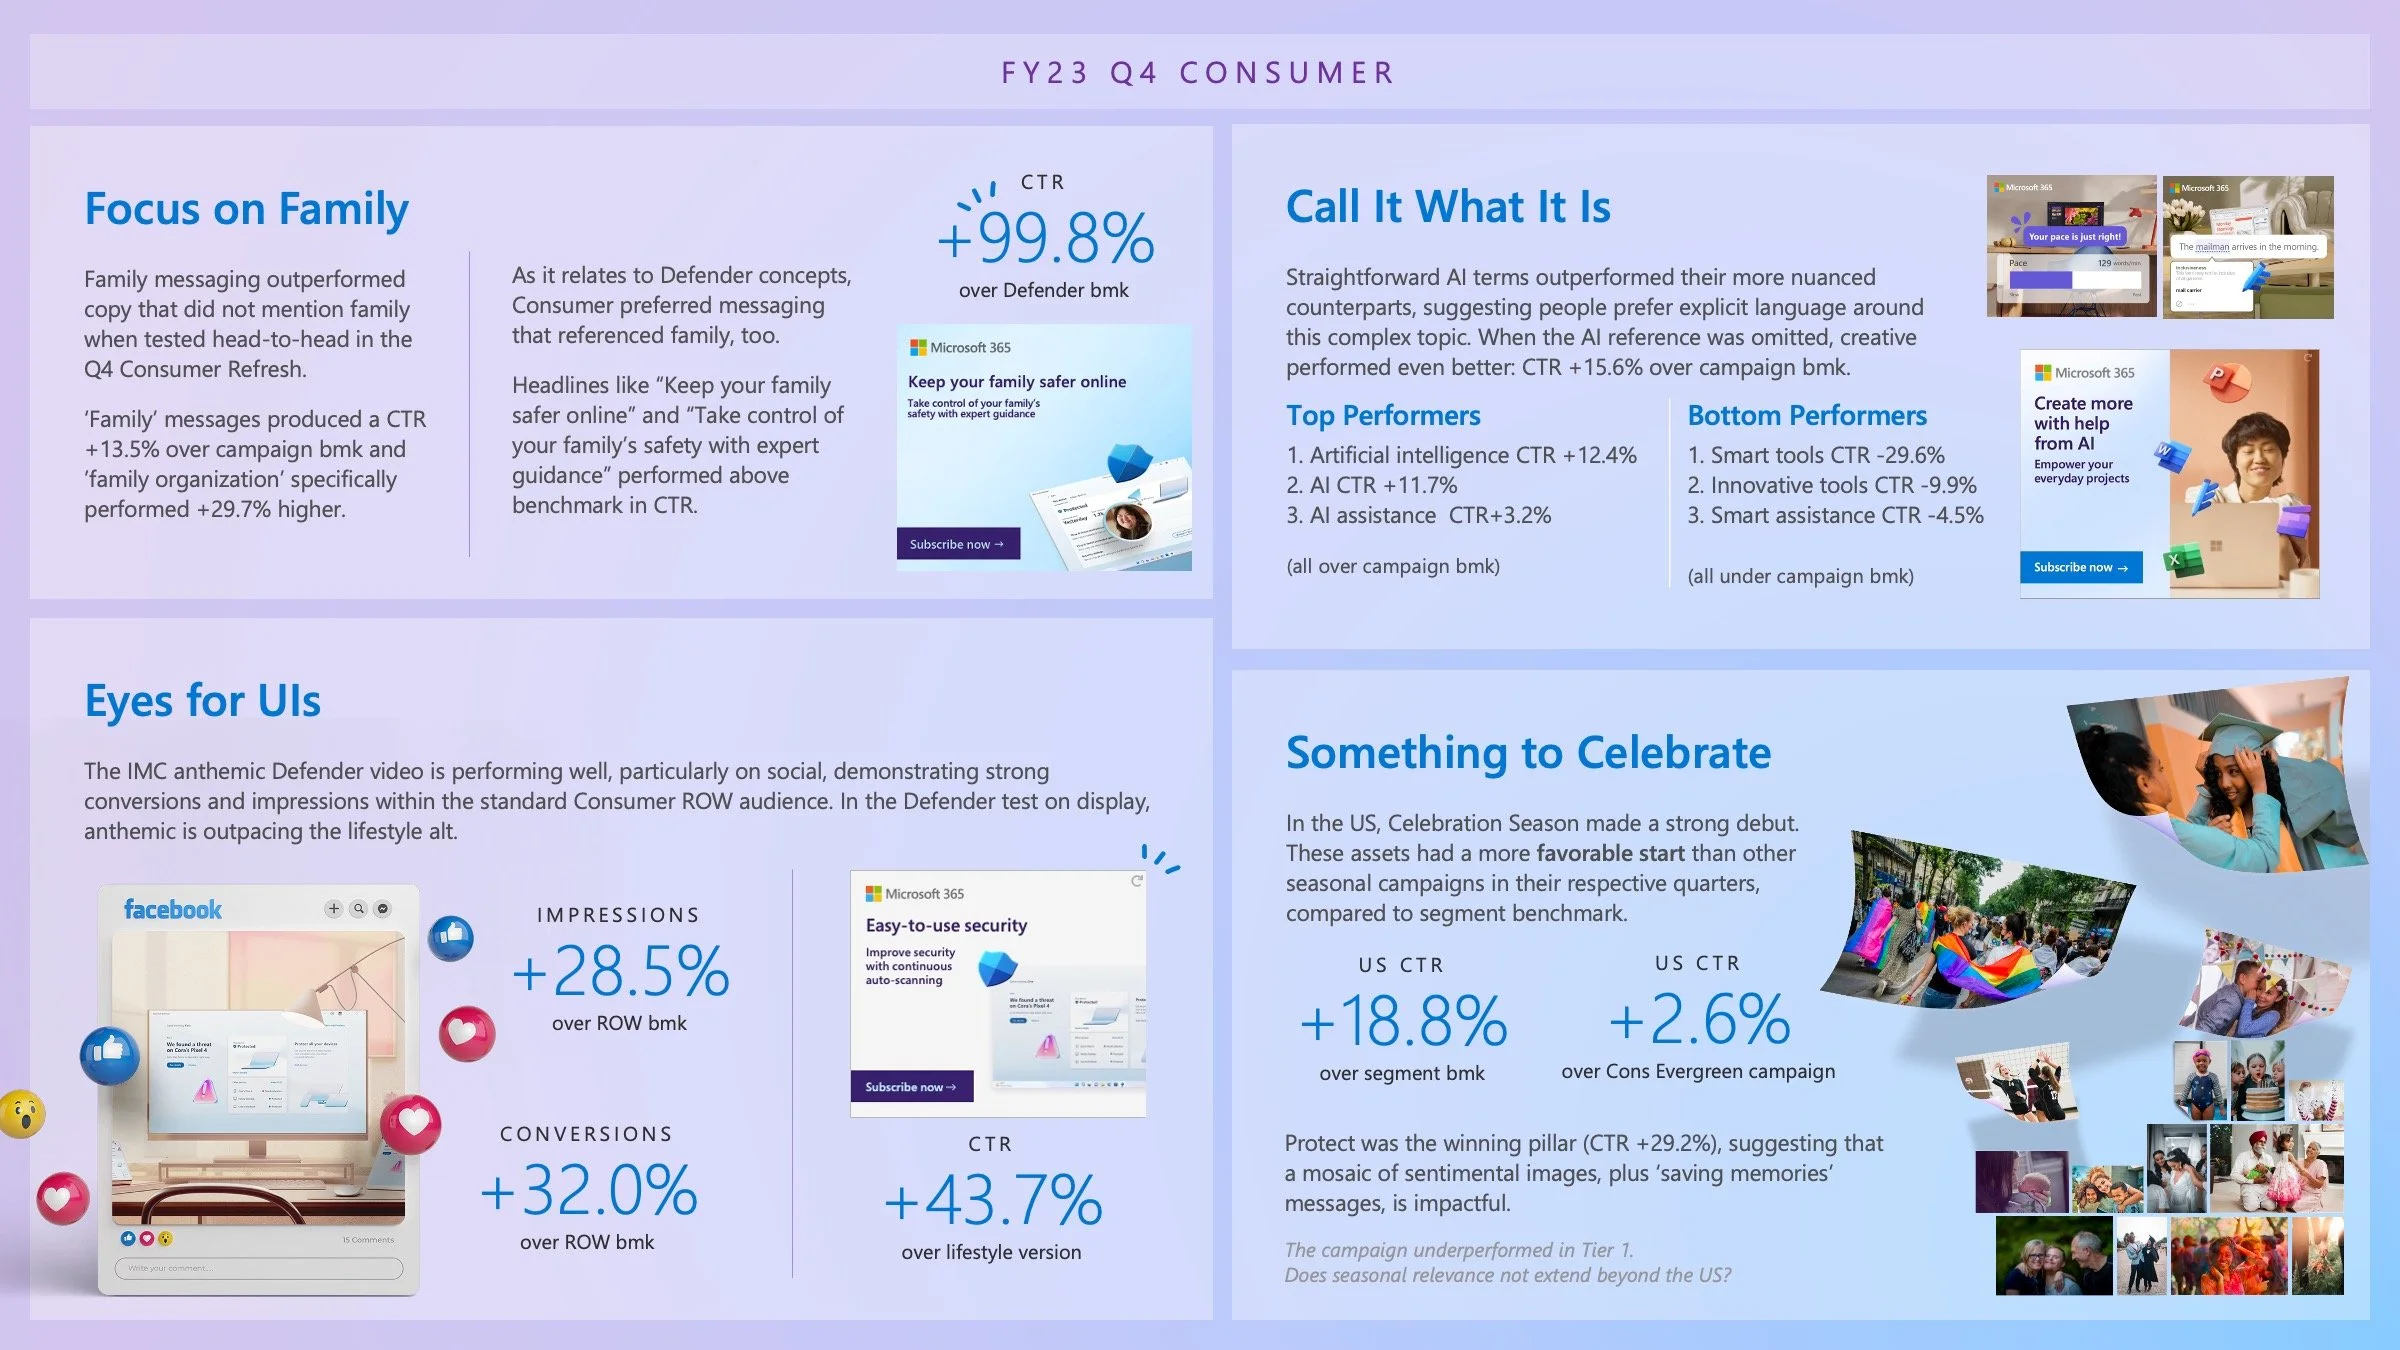
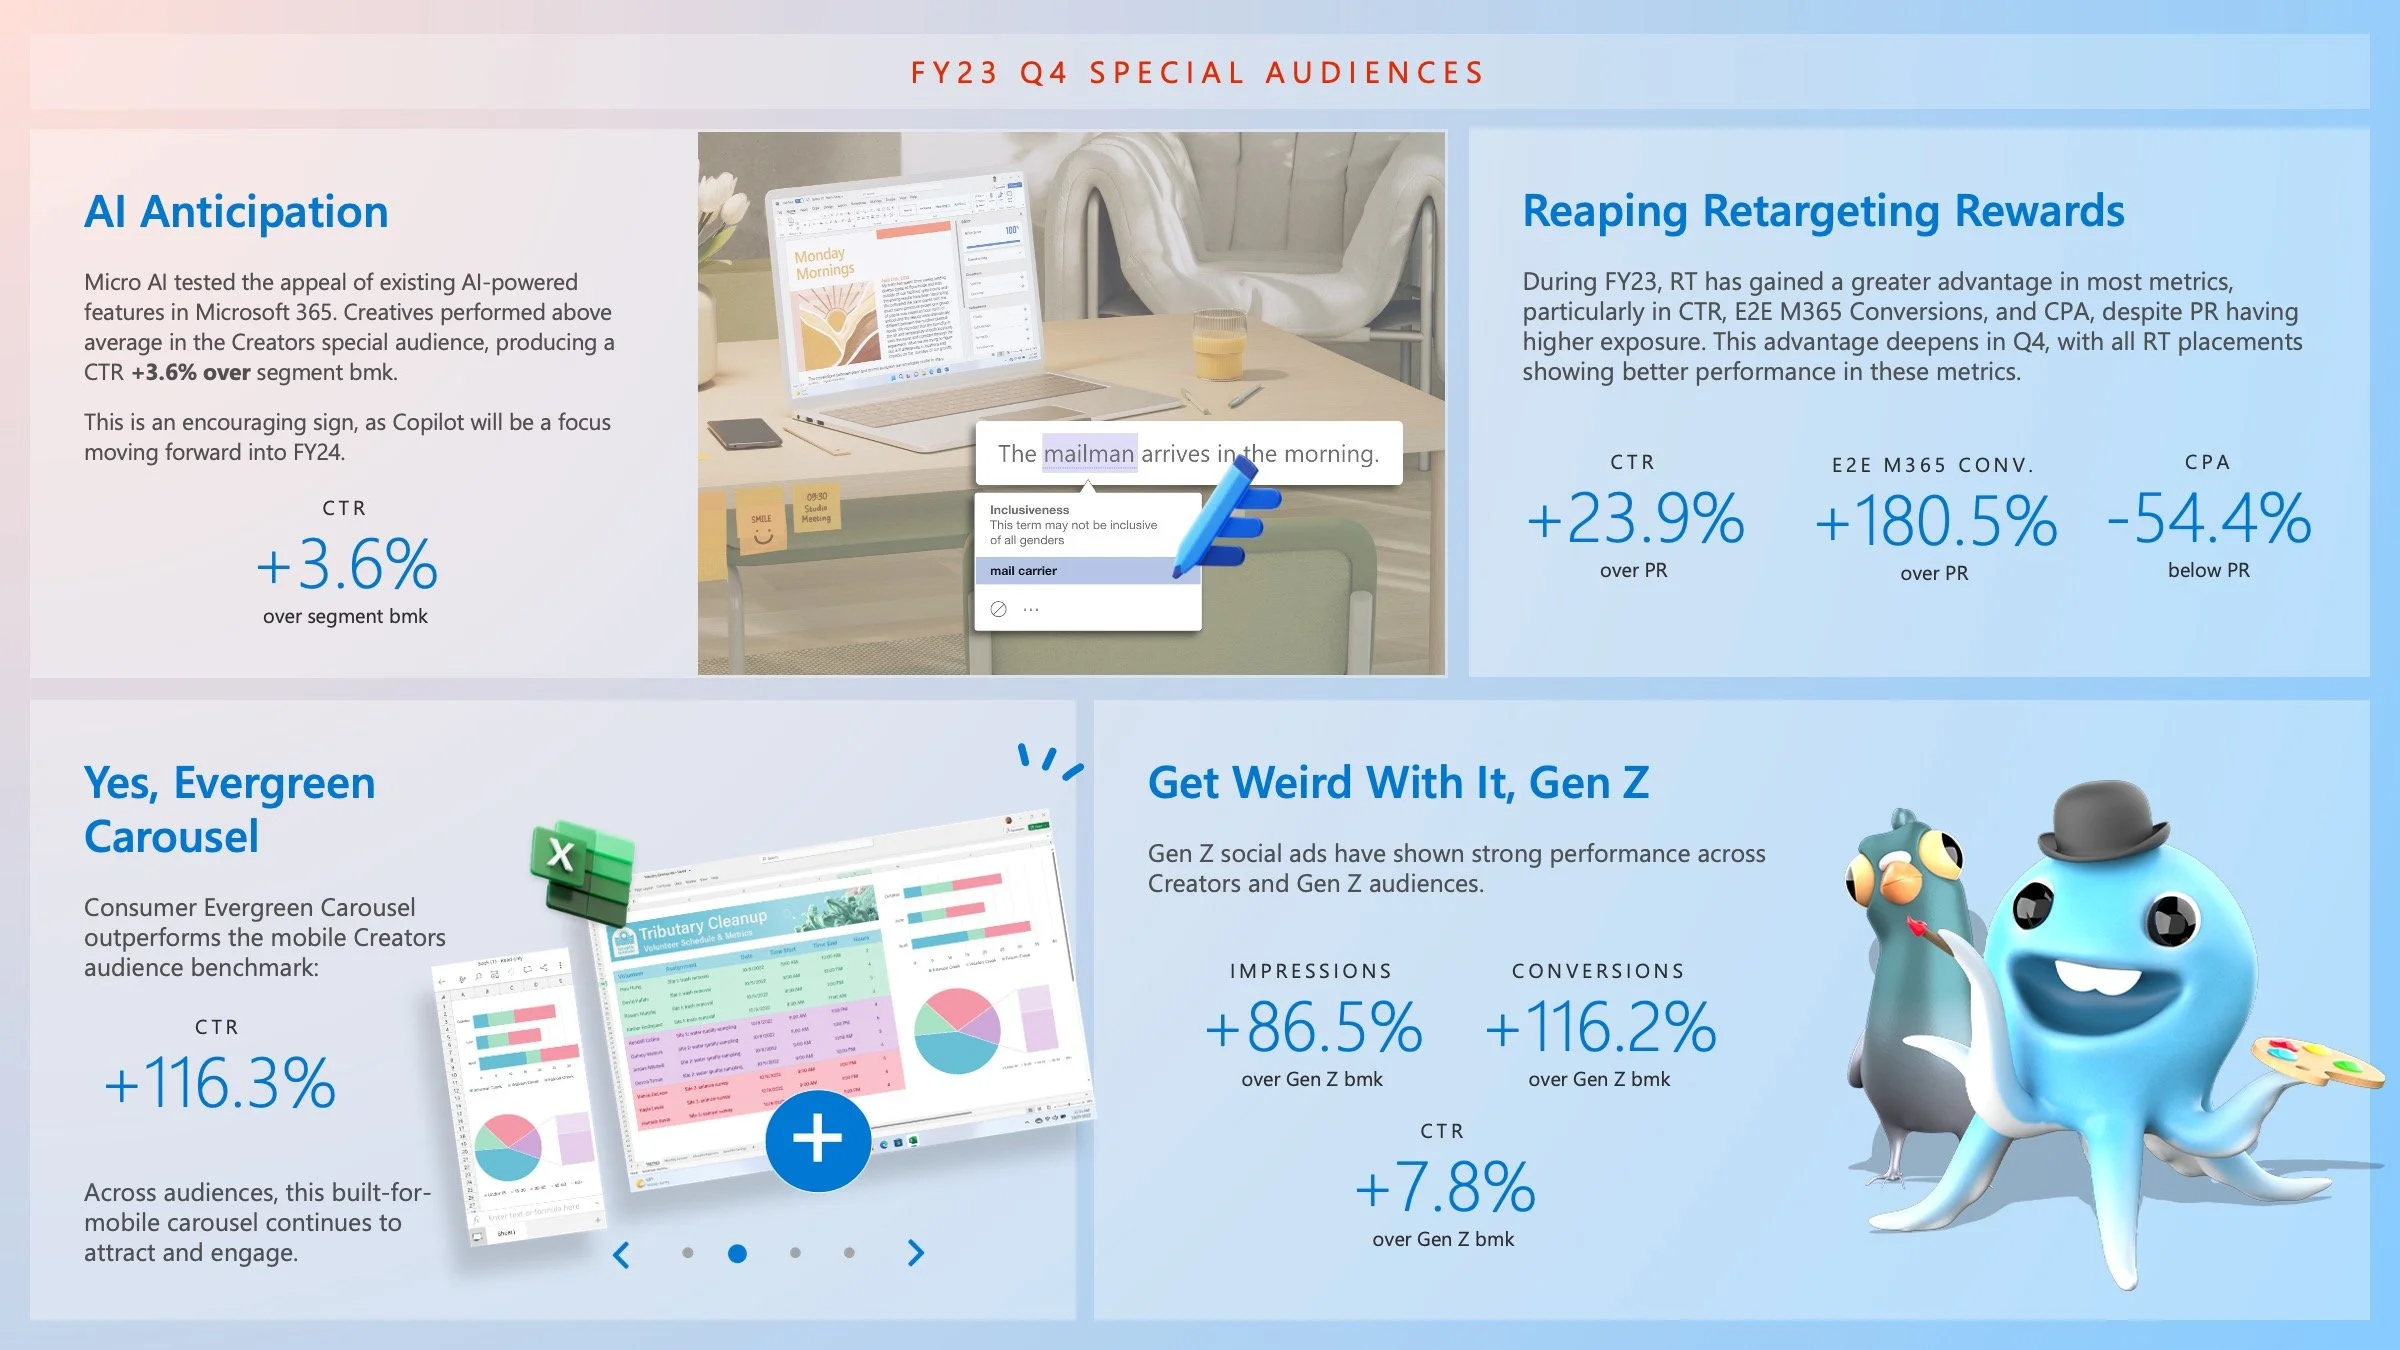
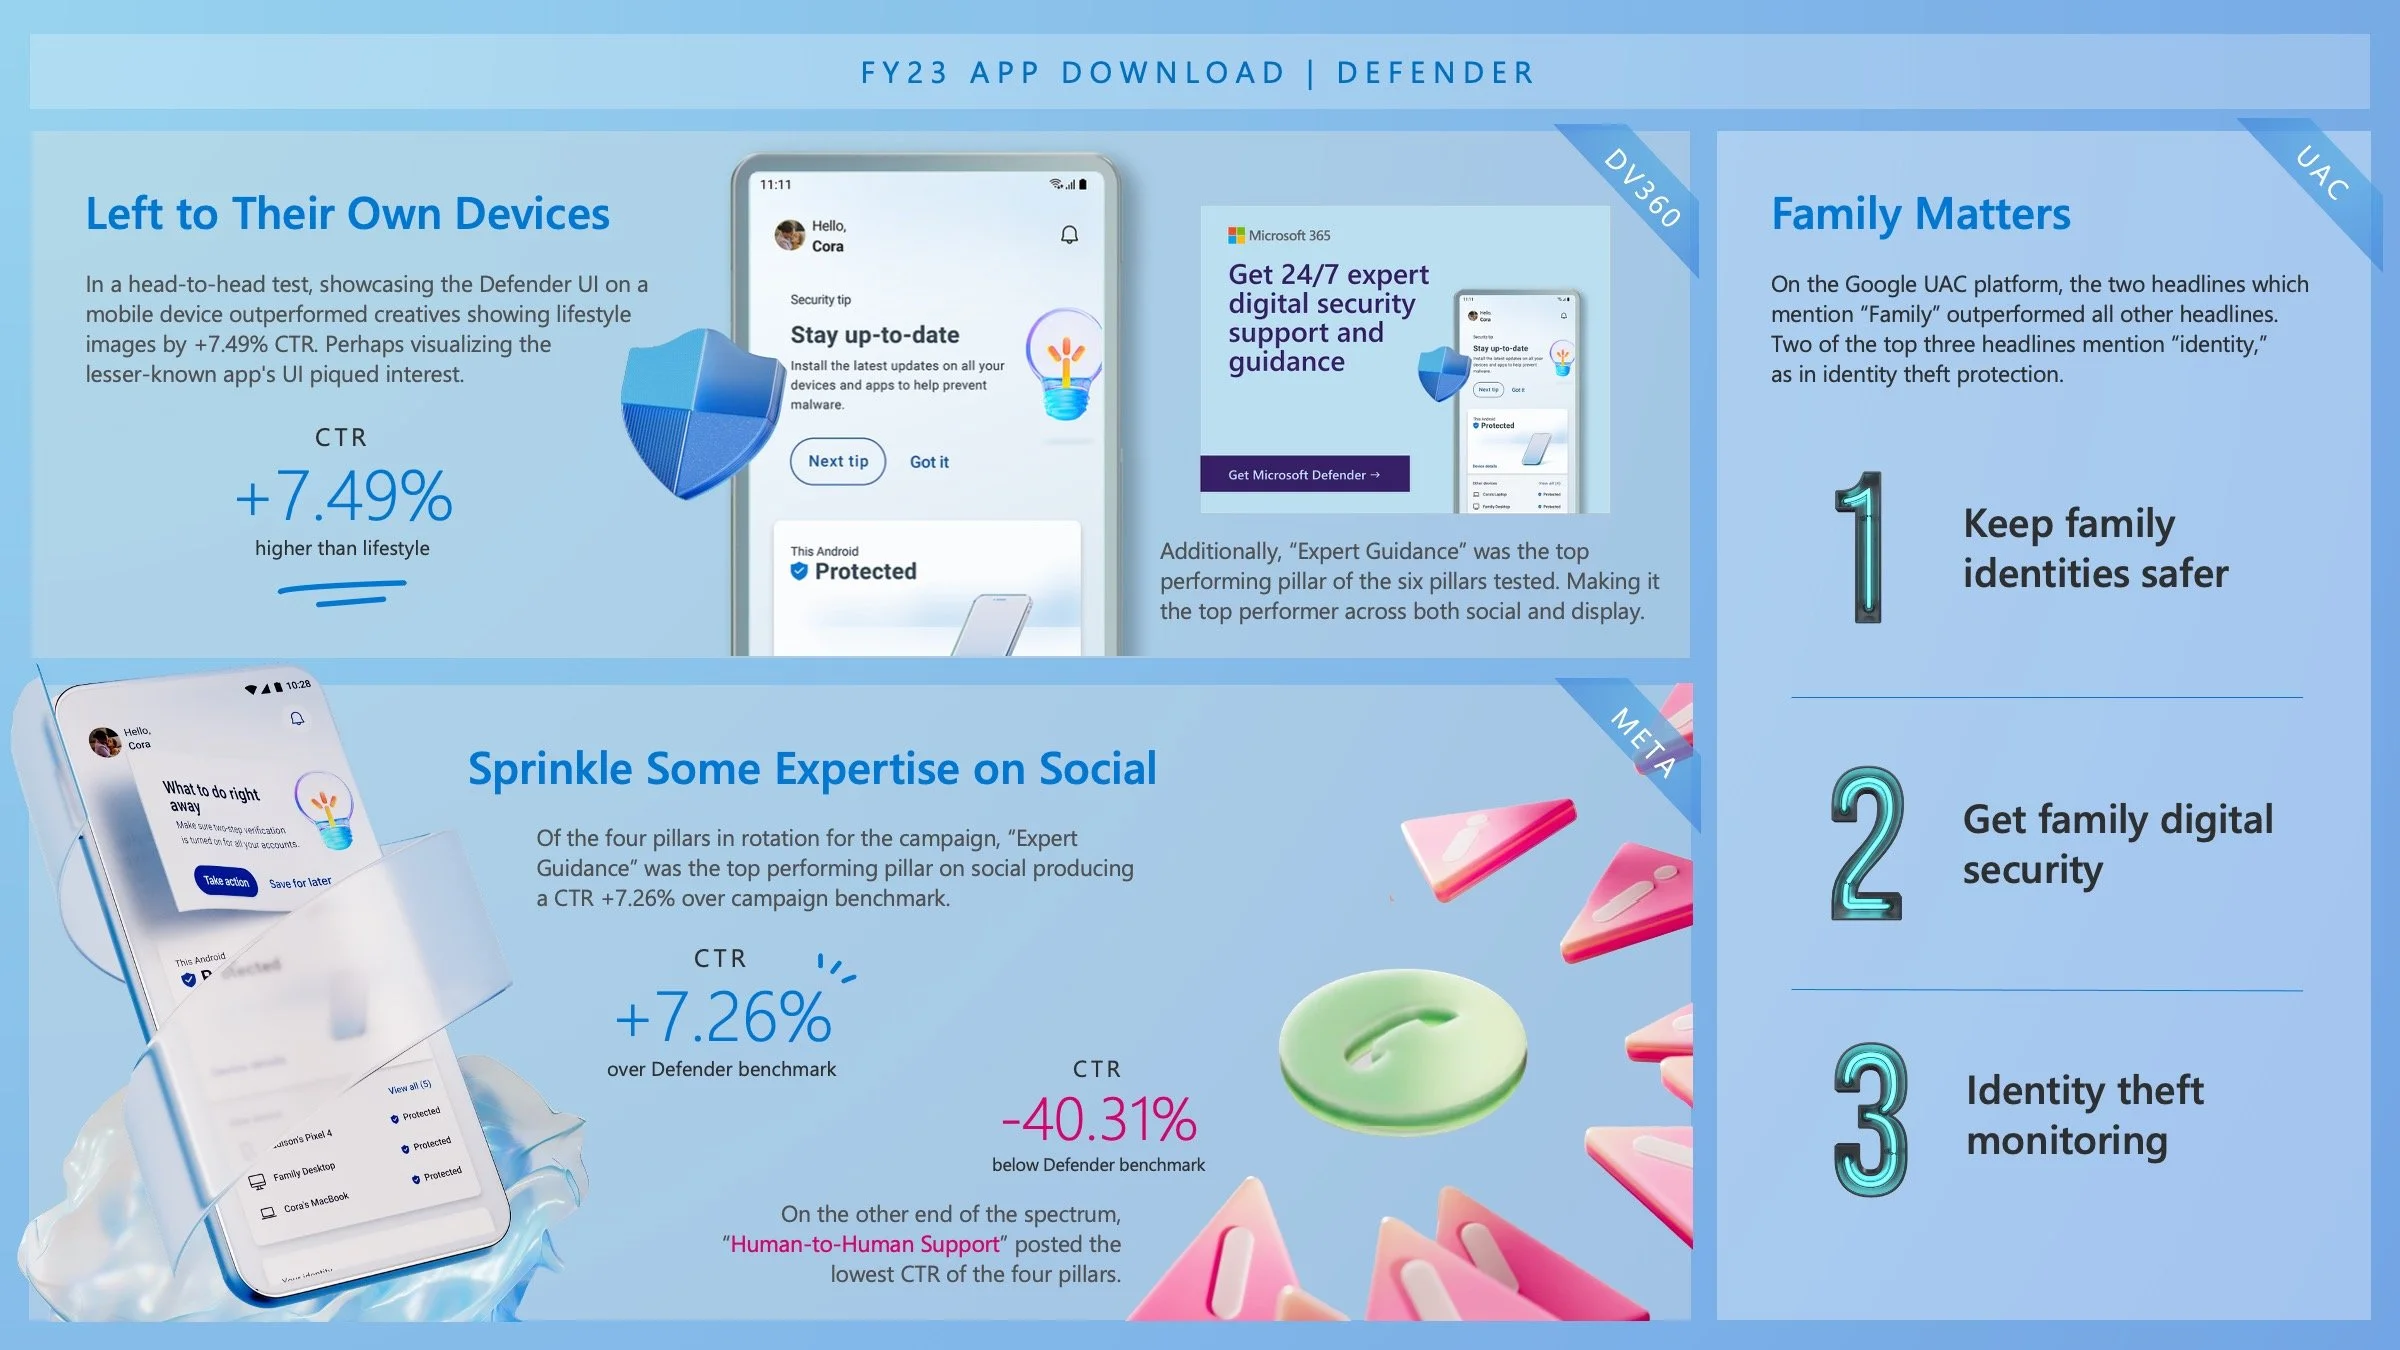
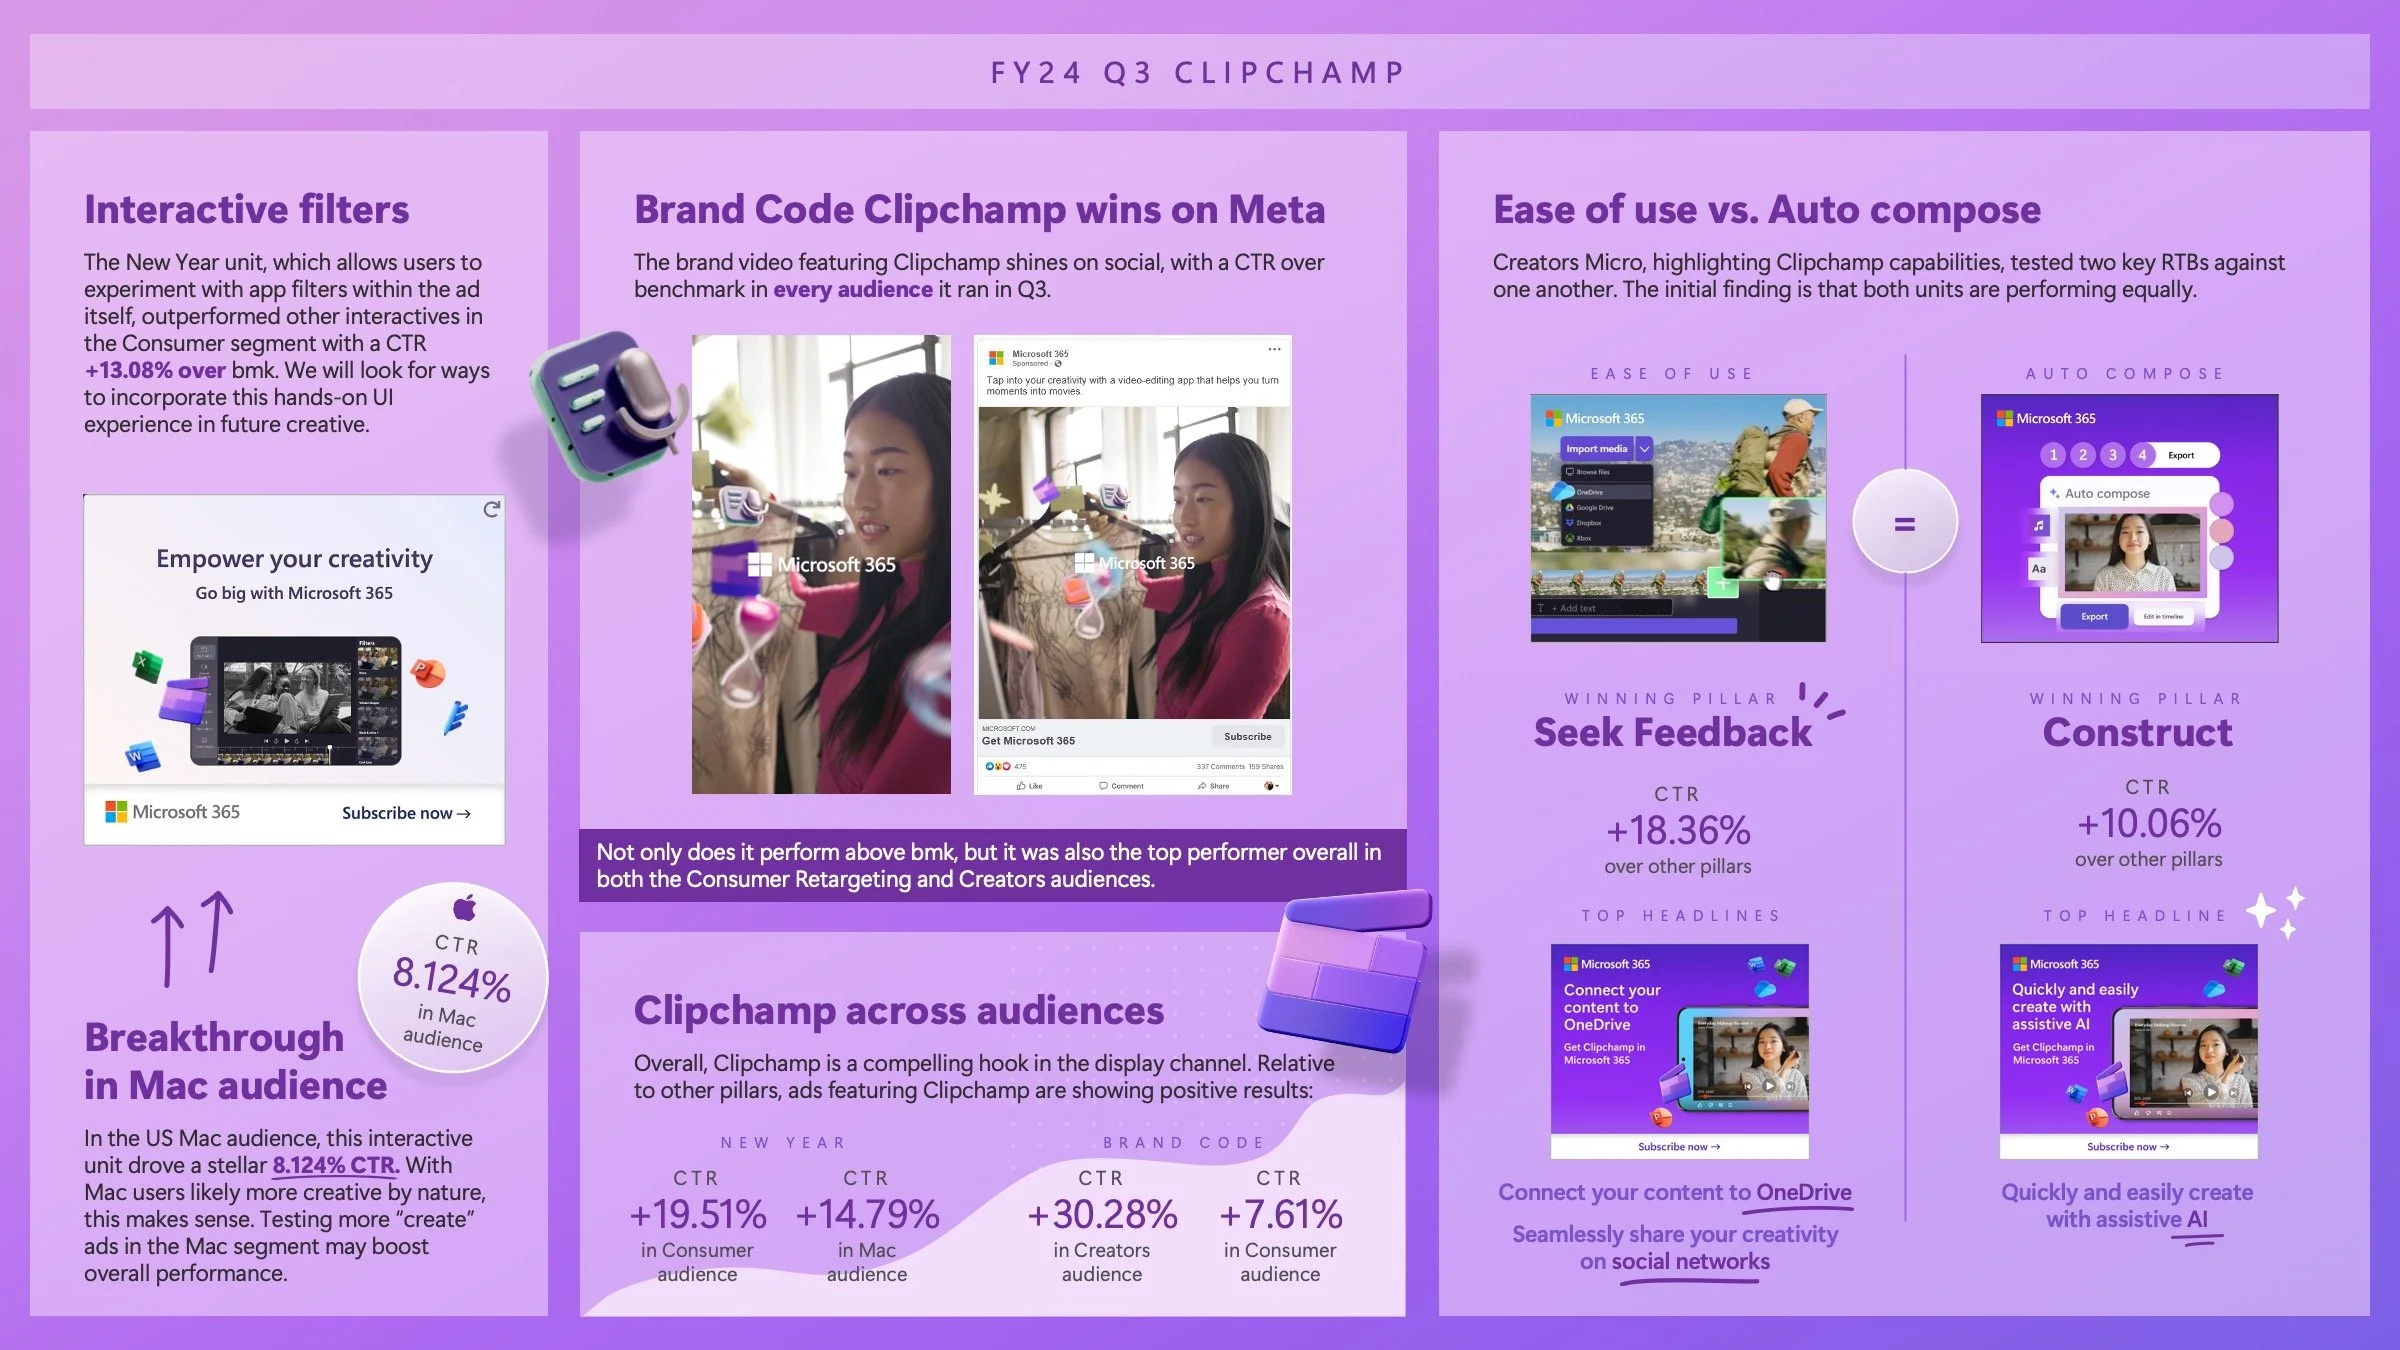
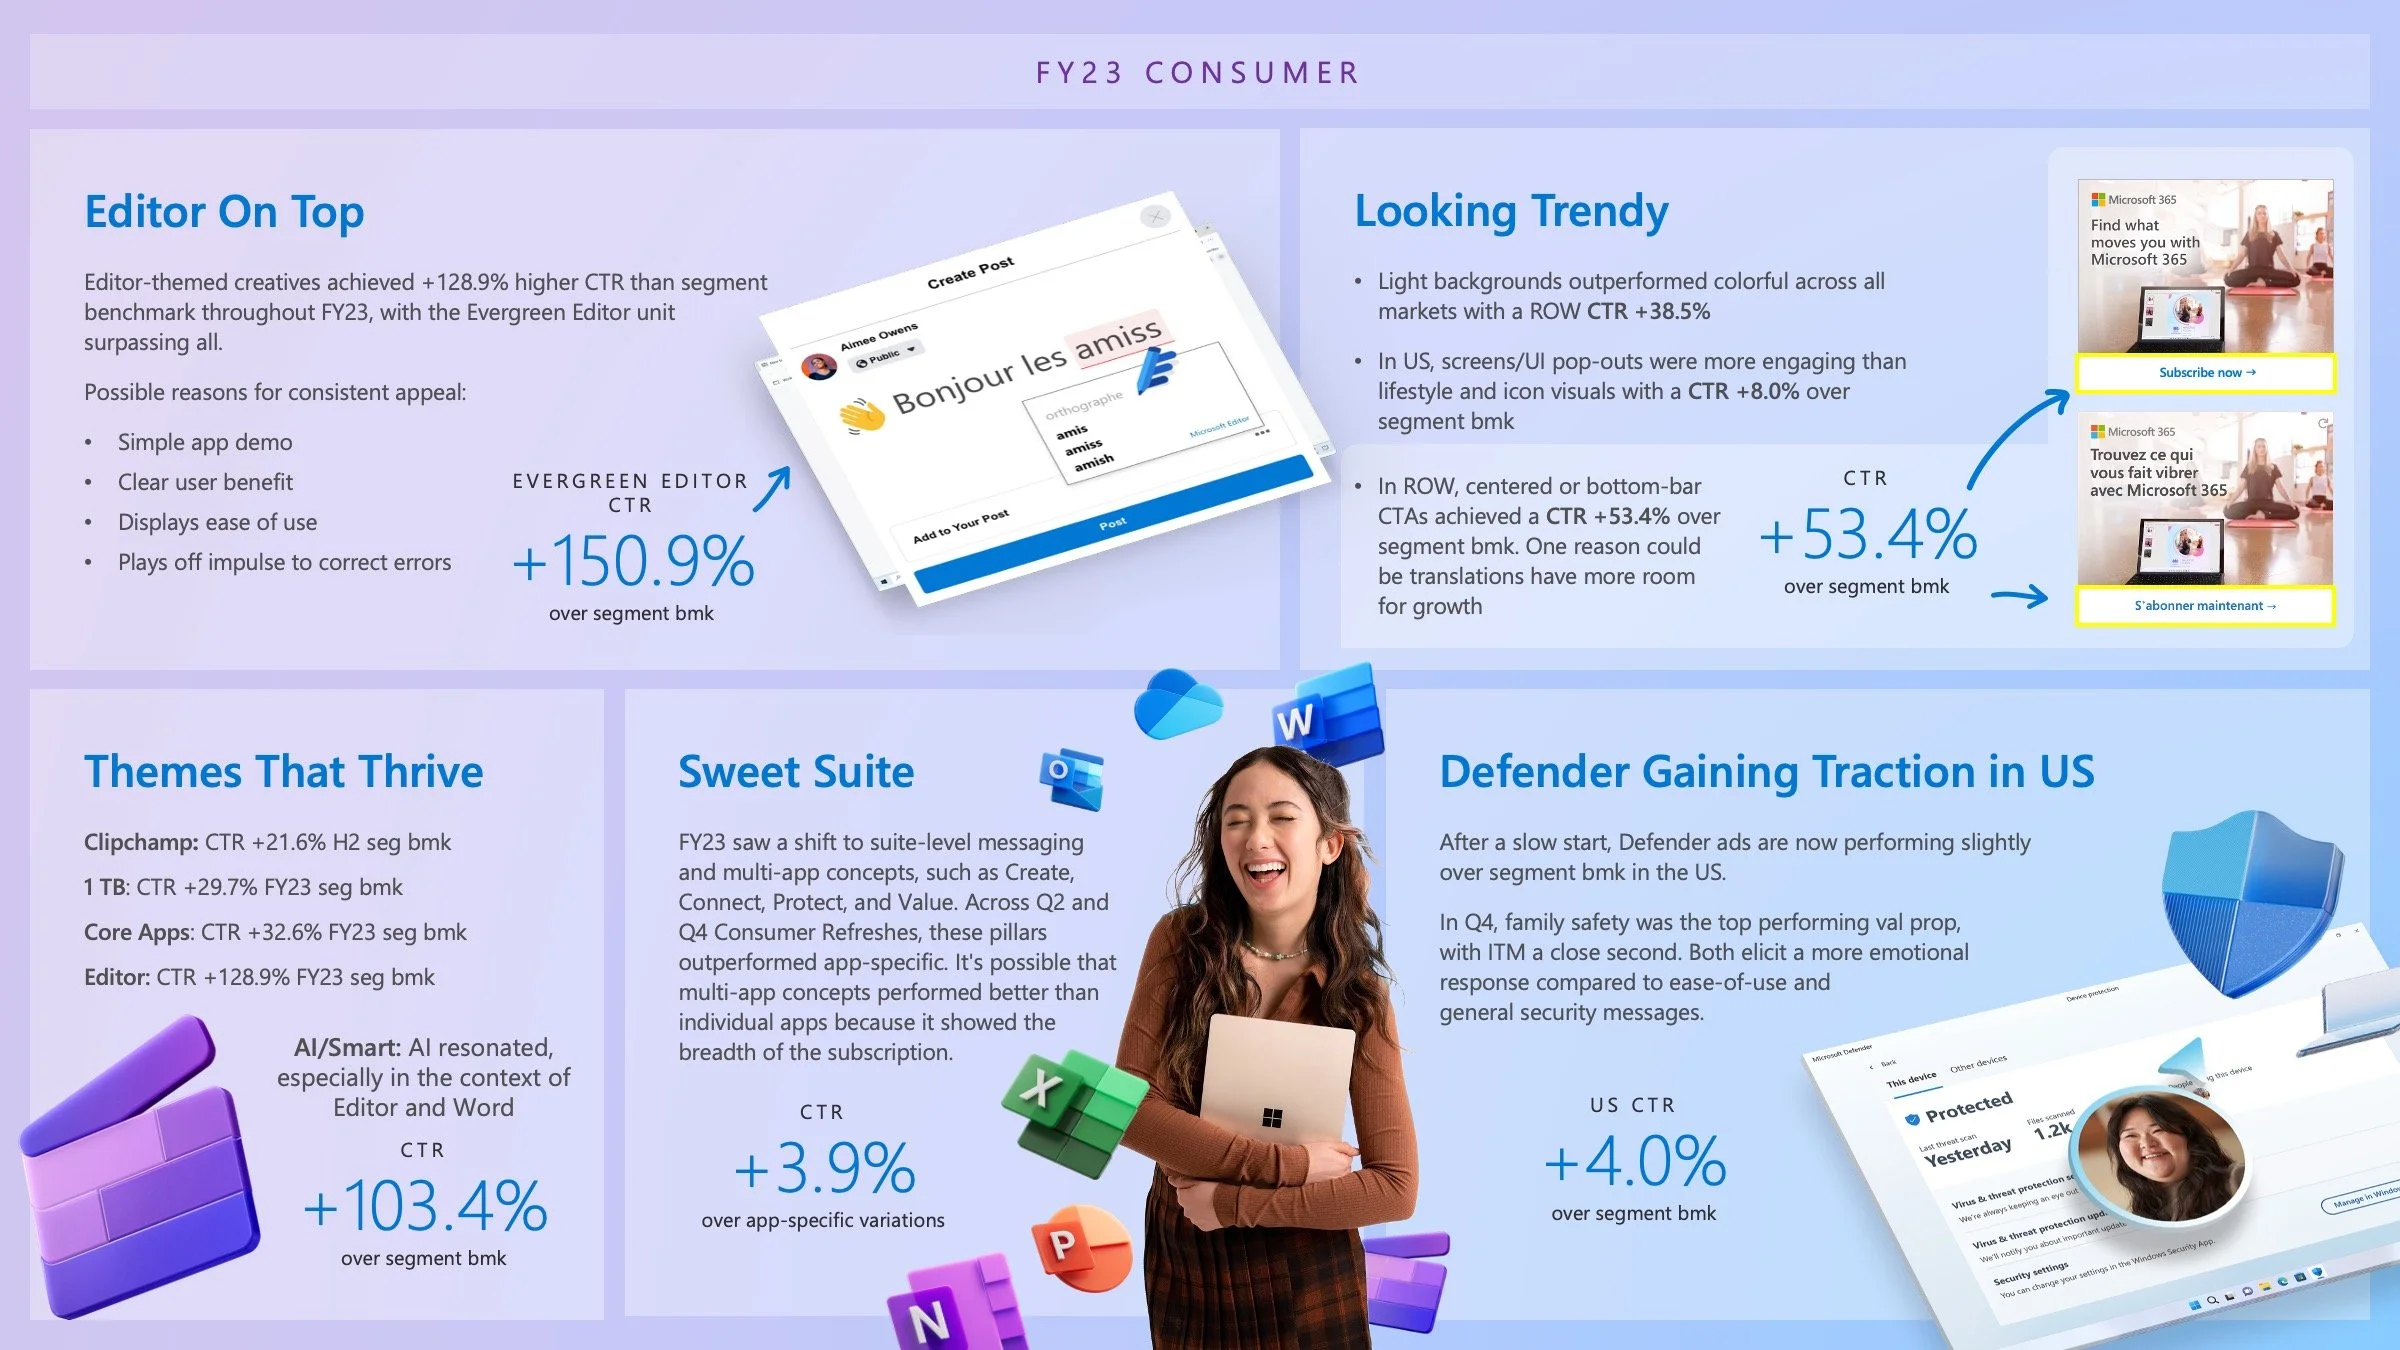
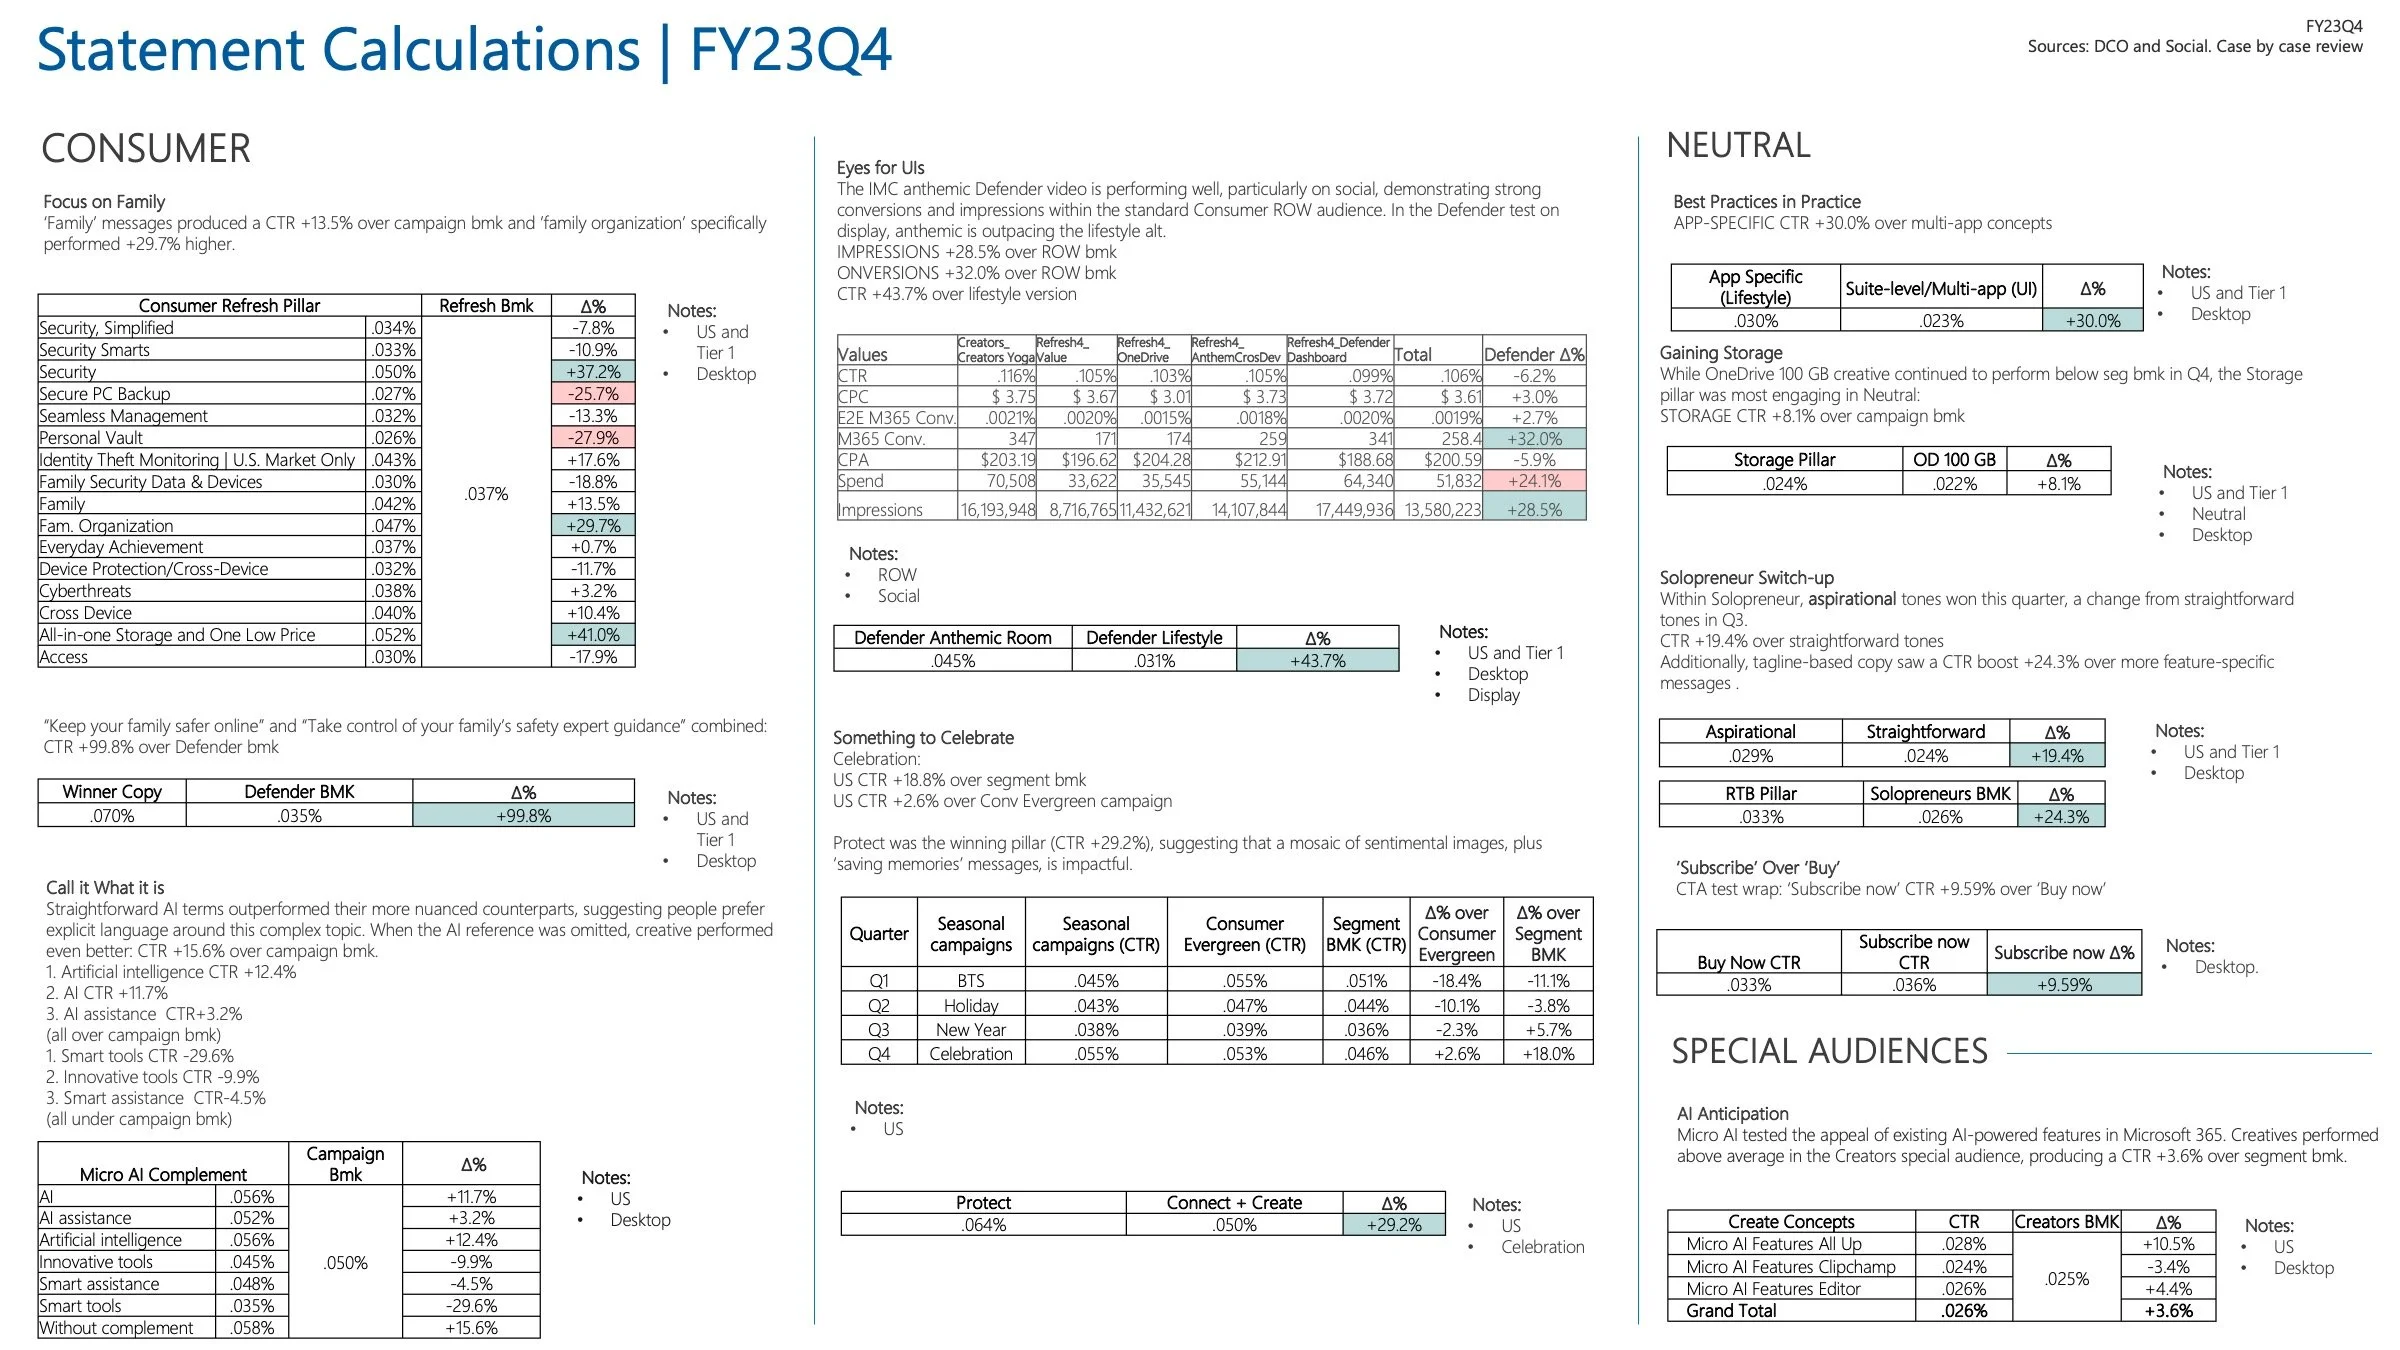
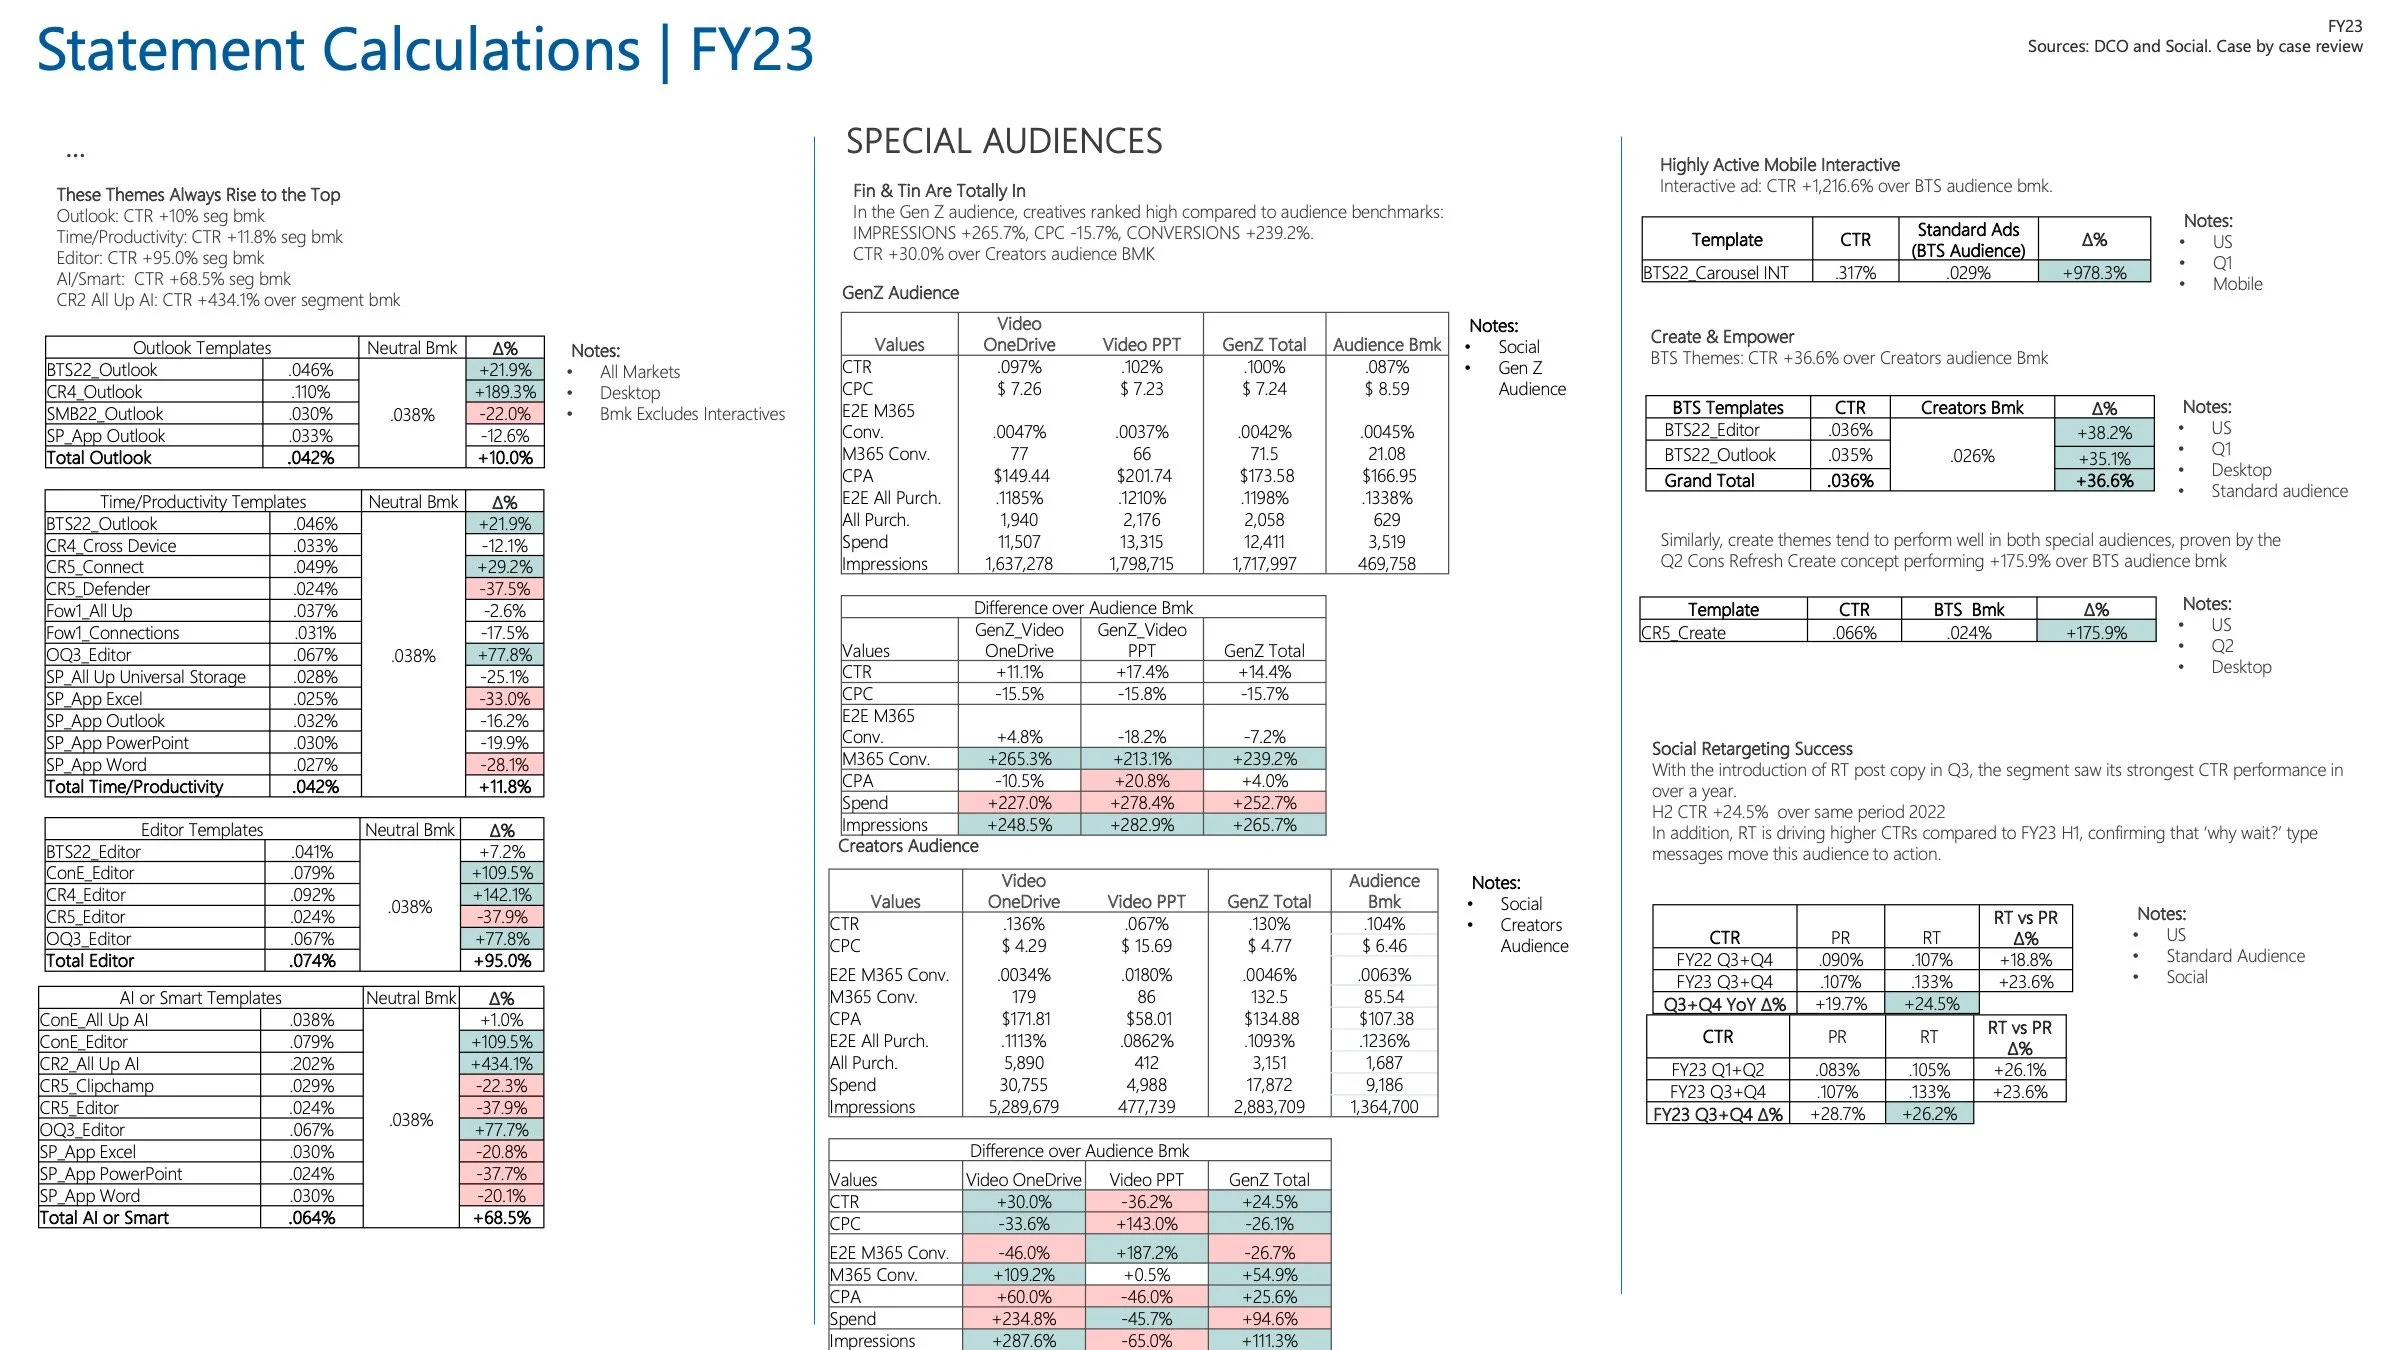
Each quarter, my team and I would collaborate with our analytics counterparts to parse through performance data slides like the ones you see below. We’d take this information and organize it into clean, aesthetically pleasing slides like you see above and present those insights back to our clients at Microsoft.